Monitoring My Bedroom's Ambient Temperature with the DS18B20
My Raspberry Pi 4 has been collecting dust on my desk ever since I used it to analyze my friends’ favorite curse words. I figured I’d get my hands on some new hardware and monitor the temperature of my room using the DS18B20 temperature sensor, Rust, PostgreSQL, and Grafana.
My goal was to plot a graph of my room’s temperature over time, which can be broken down into 3 sub-goals:
- Get the temperature readings from the sensor (Rust)
- Record the temperature readings (Rust/PostgreSQL)
- Make a pretty graph (Grafana)
I suppose item 1 has the prerequisite of getting the temperature sensor to actually transmit readings to the Pi, so let’s start there.
Hardware
Aside from building mine and a couple friends’ PCs, I have no electronics experience. Thankfully, the kit I bought made the hardware work about as simple as building a PC. All I had to do was connect the right wires to the right pins. The kit came with an adapter module with a screw terminal and resistor, so I didn’t even need a breadboard.
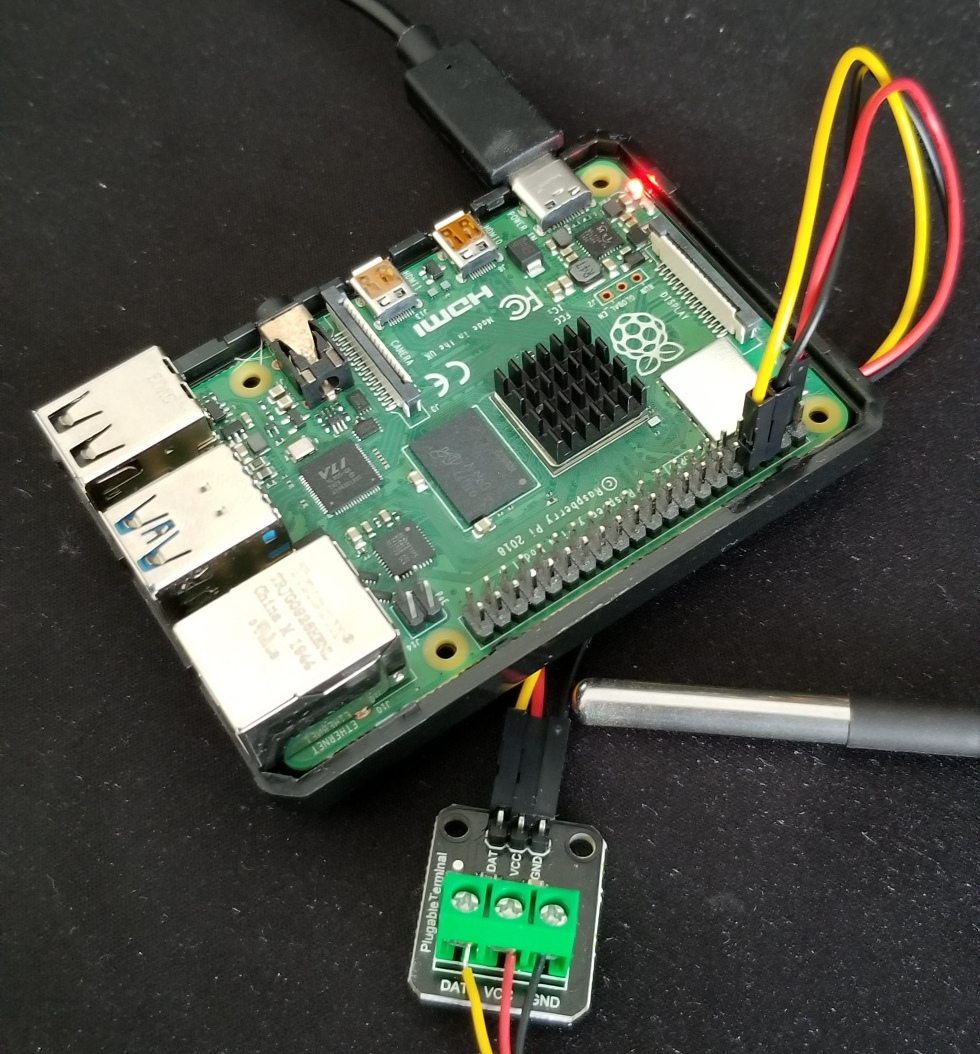
Now that I had all the hardware connected, it was time to enable the 1-Wire interface on the Pi.
Enabling 1-Wire
Enabling 1-Wire consisted of simply adding the following line to the Pi’s /boot/config.txt file and rebooting:
dtoverlay=w1-gpio,gpiopin=14
If you’re trying this for yourself, it’s important to note that gpiopin should be set to whatever GPIO pin you connected the DS18B20’s data line to.
Verifying Functionality
If all went well, I should see a file /sys/bus/w1/devices/$ID/w1_slave/, and reading it should give me some meaningful output.
pi@fusco:~ $ cat /sys/bus/w1/devices/.../w1_slave
97 01 4b 46 7f ff 0c 10 e3 : crc=e3 YES
97 01 4b 46 7f ff 0c 10 e3 t=25437
Success! I’m not sure what the hex values represent, but some quick experimentation showed that t=X represents the temperature reading X in degrees celsius, multiplied by 1000.
Now that the sensor works, it’s time to start writing some code.
Software Time
Python would be the sensical choice for this project. It’s simple and would run on the Pi with no trouble.
But where’s the fun in that? I’ve been itching to write some Rust code recently. It’s a great language, and the issue of cross-compilation seemed a more interesting challenge than having Python code Just Work™. The first step in the journey was to get any Rust code to successfully cross-compile and run on the Pi, so I started with Hello World.
Cross Compiling to ARM
Cross-compiling Rust code to run on the Pi proved to be fairly straightforward. All I had to do was
- Install the build target by running
rustup target add armv7-unknown-linux-gnueabihf - Download the GNU ARM toolchain to link the final executable
- Tell
cargoto use the aforementioned linker for the aforementioned target
Item 3 was simply adding the following lines to my user’s .cargo/config file:
[target.armv7-unknown-linux-gnueabihf]
linker = "/path/to/arm/gcc"
To make my life easier, I also wrote a quick shell script to automatically build the program, copy the binary to the Pi, and run it. I still have to type the Pi’s password twice, but it’s better than nothing:
#!/bin/bash

# I named my Pi fusco, after the character from Person of Interest

cargo build --release --target armv7-unknown-linux-gnueabihf
scp target/armv7-unknown-linux-gnueabihf/release/ds18b20-parser fusco:/home/pi/ds18b20
ssh fusco '/home/pi/ds18b20/ds18b20-parser'
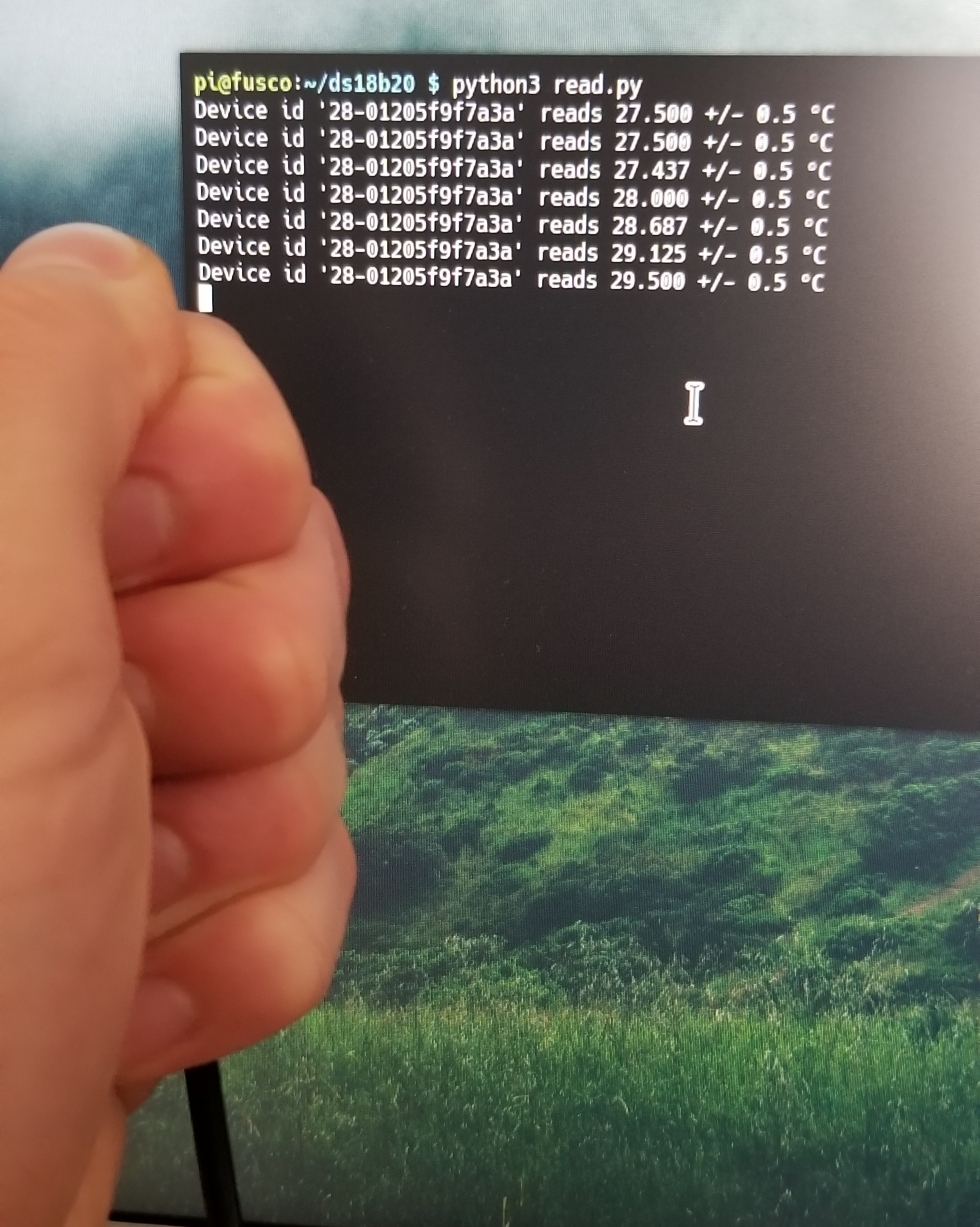
And sure enough:
λ ./deploy.sh
   Compiling ds18b20-parser v0.1.0 (...)
    Finished release [optimized] target(s) in 0.68s
pi's password:
ds18b20-parser                             100% 3266KB   2.1MB/s   00:01
pi's password:
Hello, world!
Hooray!
Writing the Parser/Recorder
I won’t go into too much detail on the implementation of the parsing/recording logic. If you like, you can view the source on GitHub. Essentially, the program does the following in a loop:
- List the
/sys/bus/w1/devicesdirectory to look for sensors - Read each sensor
- Insert the readings into the PostgreSQL database
- Sleep for user-specified delay
I added the support for a delay between readings primarily to save on disk usage. Without the delay, the program was getting a reading evey half-second or so, and this project doesn’t require anywhere near that level of resolution. I’ve been running it with a minute delay between each reading, and that seems to generate a clean and accurate graph.
Graphing Readings with Grafana
Creating the graph was dead simple. I already had Grafana set up for a previous project, so all I had to do was create a new dashboard and create a graph with time on the X axis and temperature on the Y axis.
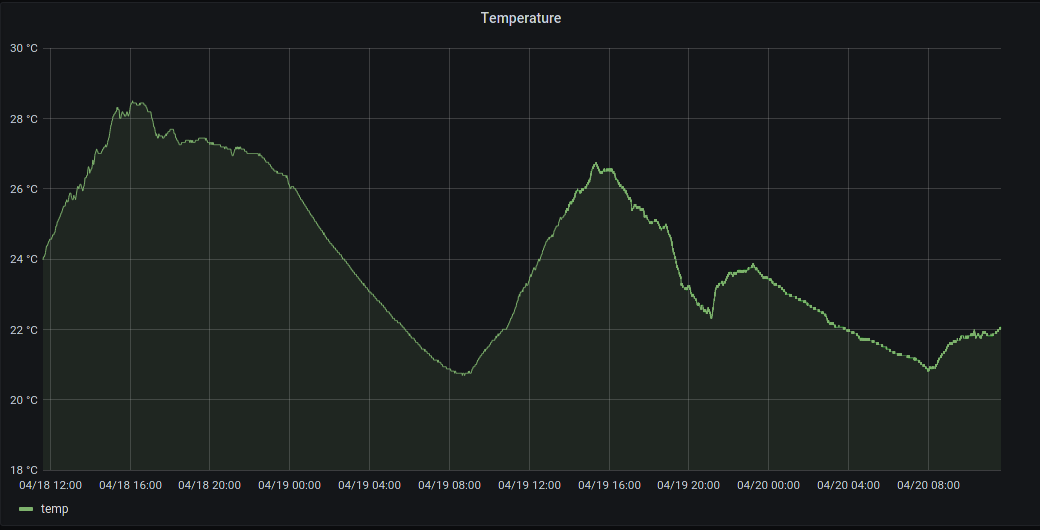
Voila!
Conclusion
This was a fun little project to get my hands on some new hardware and make a pretty graph. Once I’ve collected more data, I might do some more analysis using pandas and matplotlib, but I’m happy with my results so far.